When using CRaC to create a checkpoint image, Java applications need to properly handle the external resources they hold, such as open log files, listening service ports, and external database connection pools.
For files opened by a Java application, CRaC can handle them automatically by defining File Descriptor Policies. For listening ports or connection pools enabled by the application, it is generally recommended that the application implements CRaC’s Resource interface to close these resources before a checkpoint and reopen them after a restore.
To properly handle network resources held by a Java application, one must first know where these resources are created. However, in real-world development, applications usually do not call the JDK’s basic network APIs directly. In most cases, network connections are handled by frameworks like Netty or Dubbo, so developers may not even know where listening ports are opened or network connections are created.
Furthermore, some resources, like Unix sockets, are not typically created directly by Java but are opened by the underlying JVM or dependent C libraries, making it even more difficult to trace their creation.
This article will introduce how to use BCC and async-profiler to trace and locate the specific points of Socket creation in a Java application.
# Using BCC to Trace and Locate Unix Socket Creation
Let’s start with a concrete example. When creating a checkpoint image for a Java application, the following exception was encountered:
|
|
Even though the JVM parameter -Djdk.crac.collect-fd-stacktraces=true was added, the logs still did not show the specific location where file descriptor 4 (FD 4) was opened. This usually means that FD 4 was likely opened in Native Code.
We use the lsof command to view the details of FD 4:
|
|
The fifth column, unix, indicates that the resource corresponding to this file descriptor is a Unix socket.
To further investigate the origin and purpose of this Unix socket, we need to find out which process is connected to the other end:
|
|
From the output, we can see that file descriptor 4 is connected to an external process, lwsmd. This is a security authentication-related service used to integrate Linux into Windows Active Directory. The Java process communicates with lwsmd via a Unix socket to implement user authentication and permission management.
Additionally, we found a pair of file descriptors, 407 and 408, which are the two ends of a Unix socket, both created and held by the Java process itself. This resource pair did not throw an exception during the checkpoint process, indicating they were handled properly.
Now we know the Java process creates these Unix sockets, but the key question is: How do we locate the exact creation point?
The most direct way to find the source of Unix socket creation is to trace the system call it triggers at the kernel level. By capturing the complete call stack at the moment the system call occurs, we can trace it back to the specific code location.
At the application level, code creates Unix sockets by calling the socket() and socketpair() library functions provided by glibc. These functions prepare the arguments and then execute a special CPU instruction to switch from user mode to kernel mode, initiating the actual system call.
To observe this event in the kernel, we can use the kernel’s static probe points: Tracepoints. Tracepoints are static probes preset by kernel developers in the kernel code, allowing us to observe key kernel activities. When a system call request enters the kernel, the corresponding tracepoint is triggered, and we can use tools to capture this event and get context information, including the call stack.
For creating Unix sockets, we are interested in the following two tracepoints:
syscalls:sys_enter_socket: Triggered when thesocket()system call enters the kernel.syscalls:sys_enter_socketpair: Triggered when thesocketpair()system call enters the kernel.
Since the socket() function can create various types of sockets (TCP, UDP, etc.), we must add a filter to our tracing to only capture calls where the first argument, family, is AF_UNIX. This allows us to precisely target the creation of Unix sockets.
To achieve this, we will use BCC (BPF Compiler Collection), a powerful toolset.
BCC comes with a general-purpose trace tool that can trace any function. We can use it for a quick proof of concept:
|
|
-K,-U: Capture kernel and user-space stacks, respectively.t:syscalls:sys_enter_socket: Specifies thetracepointto trace.(args->family == 1): A filter to only care aboutAF_UNIX(value 1) type socket creations.
The output of this command is as follows:
|
|
As you can see, this command successfully captured the socket call and its stack. However, it has a major drawback: the output does not include the file descriptor returned by the system call. Therefore, we cannot associate this stack with the FD 4 we are interested in.
To get the file descriptor returned by socket() or socketpair(), we need to write a custom BCC script:
|
|
The idea behind this script is to store information on system call entry (sys_enter_*) and capture the return value (i.e., the file descriptor) on exit (sys_exit_*), then send the file descriptor, stack trace, and other information to the user-space Python program for printing.
First, run this script, and then start the Java application.
|
|
Now, in the script’s output file unixsocket, we can search by the process PID (177961) and file descriptors (FD 4, 407, 408) to find the corresponding creation stacks:
|
|
For FD 4, the functions __nscd_get_mapping and __nscd_get_map_ref in the call stack are key clues. They indicate that glibc is attempting a name service query (e.g., resolving a username). This explains our earlier observation of why the Java process connects to lwsmd. The __nscd_* functions are the generic client logic used by glibc for name resolution, and the actual service it connects to is determined by the system’s NSS (Name Service Switch). In my test scenario, the NSS configuration directs authentication queries to lwsmd, which is why the Java process connects to it via a Unix socket. At this point, we know the purpose and origin of FD 4. How to handle this resource requires further exploration, but at least we have identified the root cause.
Looking at FDs 407 and 408, we can see function calls from libjvm.so, which clearly indicates that a Java thread called socketpair to create this Unix socket pair. However, the most critical part of the call stack is shown as [unknown].
This is because the JIT (Just-In-Time) compiler dynamically compiles hot code into machine code at runtime and stores it in anonymous memory regions. These regions do not have traditional symbol tables, so general-purpose system-level tools like BCC cannot find any symbol information when trying to resolve these memory addresses, and can only display them as [unknown].
Although this Unix socket (FDs 407, 408) was handled properly and did not cause a CRaC exception, if we are curious and want to know exactly which piece of Java code created it, what should we do?
To solve the [unknown] problem, we need a tool that understands the Java runtime better: async-profiler.
# Using async-profiler to Trace Socket Creation
async-profiler is a low-overhead, high-precision performance analysis tool for Java that directly utilizes Linux’s perf_events subsystem and HotSpot JVM-specific APIs to collect performance data.
Compared to traditional Java Profilers, it can not only analyze Java code but also monitor the activities of non-Java threads (like GC and JIT compiler threads) and display native and kernel frames in call stacks, giving us a complete view from Java methods down to C/C++ library functions and kernel system calls.
General-purpose system tracing tools like BCC do not understand the internal workings of the JVM. When they encounter machine code generated by the JIT compiler in anonymous memory regions, they cannot find corresponding symbol tables and thus cannot resolve method names. In contrast, async-profiler uses specific APIs provided by HotSpot (like AsyncGetCallTrace) and can parse JVM internal data structures to obtain symbol information for JIT-compiled code, accurately mapping memory addresses back to the original Java method names.
In essence, async-profiler combines the capabilities of system-level tracing tools and traditional Java profilers, providing a complete and accurate performance insight into Java applications.
#
Tracing the creation location of socketpair
In the previous section, we used BCC to trace Unix socket-related system calls. This time, we will use async-profiler to do the same, but with the ability to display Java method names in the call stack.
async-profiler supports using Linux’s perf_events, so it can capture tracepoint events from perf_events, achieving the same system call tracing as BCC. Additionally, async-profiler can be launched as a Java Agent, which means we can load it at the start of the Java process and not miss any early initialization behavior.
Returning to our previous question, to locate the Java code that created the socketpair for file descriptors 408 and 409, we can attach async-profiler as an agent when starting the Java application and specify that we want to trace the syscalls:sys_enter_socketpair event.
Modify the Java startup command as follows:
|
|
Parameter explanation:
-agentpath:/path/to/libasyncProfiler.so: Specifies the location of theasync-profilerdynamic library.start: Indicates that profiling should start immediately.event=syscalls:sys_enter_socketpair: Specifies the event to trace. Here we are interested in the entry of thesocketpairsystem call.file=/tmp/socketpair-trace.html: Outputs the analysis result as an HTML flame graph.
Note that by default, the kernel may prohibit non-root users from tracing certain sensitive kernel events (like system calls), so it’s best to start the Java application with sudo.
After the application runs and exits normally, the /tmp/socketpair-trace.html file will be generated according to the configuration.
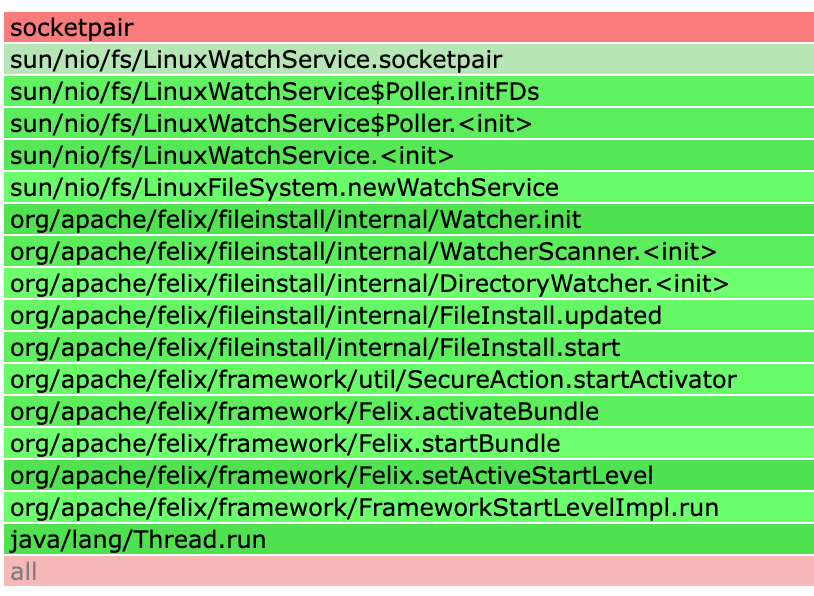
This flame graph clearly reveals the parts that BCC could not resolve ([unknown]), accurately pinpointing the Java code source that created the socketpair.
From the graph above, we can see that this socketpair was created by Java’s WatchService API in its Linux implementation. WatchService is a standard interface provided by Java NIO for monitoring directory changes in the file system (such as file creation, modification, or deletion). The call stack shows that the WatchService was called by the FileInstall component of the Apache Felix framework. Its purpose is to monitor a deployment directory to enable hot deployment of OSGi bundles.
We observed earlier that the file descriptor pair created by socketpair did not cause an exception during the checkpoint process. The reason is that CRaC already provides built-in support for the Linux implementation of Java’s WatchService (see OpenJDK CRaC PR #72). This means CRaC can automatically recognize and properly handle the internal file descriptors used by WatchService.
# Tracing the Listening Position of a Service Port
The same principle applies to locating the listening position of a network service port. For network services created with the NIO framework, the application needs to implement the Resource interface to adapt to CRaC, handling the closing and reopening of the listening port. If not handled properly, an exception similar to the following may occur when creating a checkpoint image:
|
|
From the exception message, we know that the direct cause of the checkpoint failure is that the EPollSelectorImpl instance is in a “busy” state. It appears that even though the ServerSocketChannel itself may have been closed, its registration with the Selector was not fully cancelled.
However, this exception message does not tell us where in the application this port was created and listened on. To properly handle the listening port, we must first find its creation point.
How can we do this? We can trace a key system call: bind.
The bind system call is a necessary step for any network server program to start. Its function is to associate a created socket file descriptor with a specific IP address and port number. Only after bind is successfully executed can the server listen for and accept client connections on that port. Therefore, by capturing the call stack when the bind system call occurs, we can precisely locate which piece of Java code triggered the port listening.
Use the following command to start the Java application:
|
|
After the application starts successfully and begins serving traffic, stop it and then analyze the generated /tmp/bind-trace.html file.
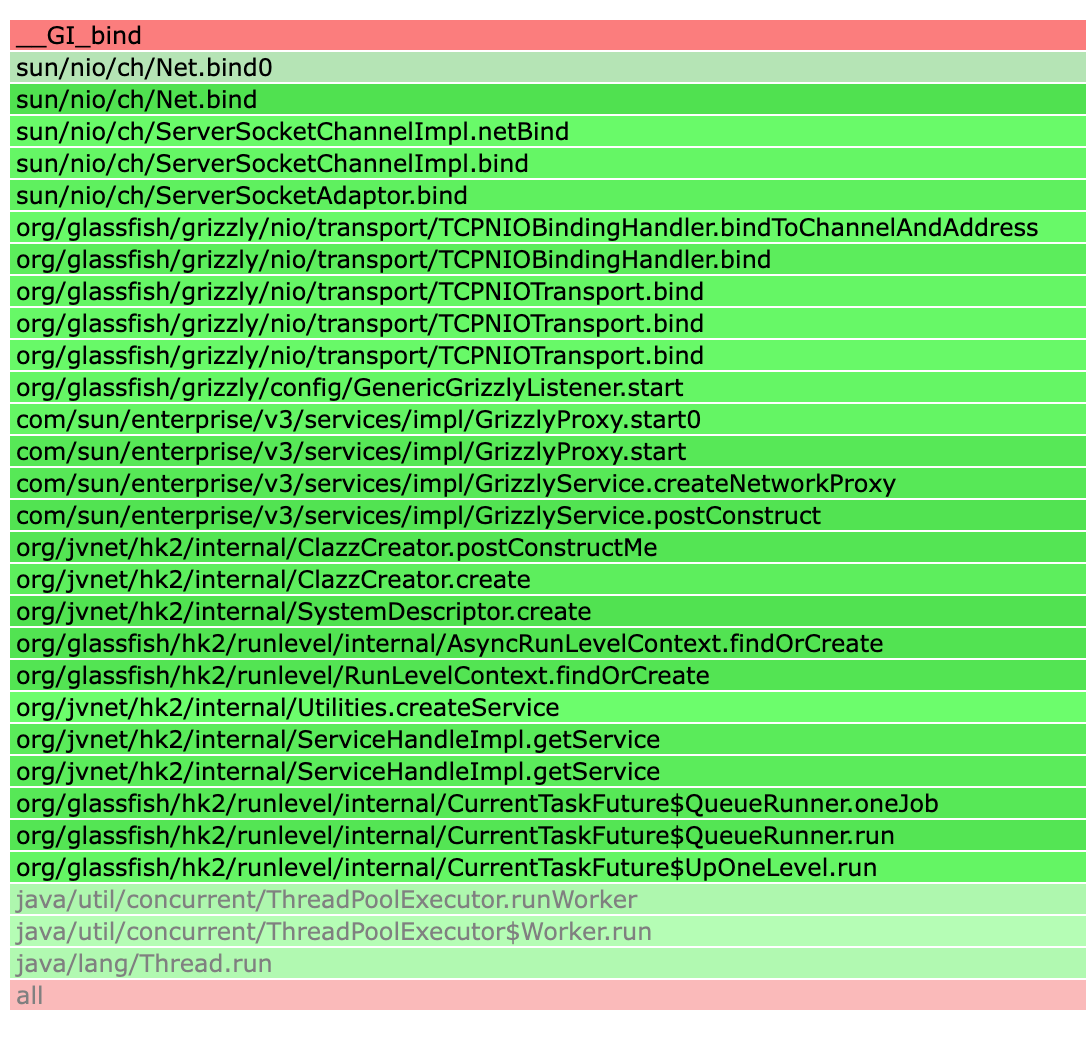
From the flame graph above, we can see that the port binding operation was performed by the Grizzly NIO framework, which acts as the underlying network engine for the GlassFish application server. The entire process is automatically triggered by the HK2 dependency injection framework during the server startup phase to initialize and start the core network services.
By analyzing the flame graph, we can conclude that implementing the Resource interface at the GrizzlyListener level would be a reasonable approach to manage the closing and restarting of the listening port.
# Summary
This article aims to solve the challenge of accurately locating the creation points of network resources (like Unix sockets and service listening ports) when adapting Java applications for CRaC.
First, it introduces the use of the system-level tracing tool BCC. Although BCC can capture the call stacks of native code by tracing system calls like socket and socketpair, it cannot resolve JIT-compiled Java code, leading to key information being displayed as [unknown].
To address this issue, the article introduces the more powerful async-profiler. It combines the capability of underlying perf_events tracing with a deep understanding of the JVM internals, allowing it to perfectly resolve symbols for JIT code. Through practical examples of tracing sys_enter_socketpair and sys_enter_bind tracepoints, it demonstrates how to use the flame graphs generated by async-profiler to trace system calls back to specific Java code.